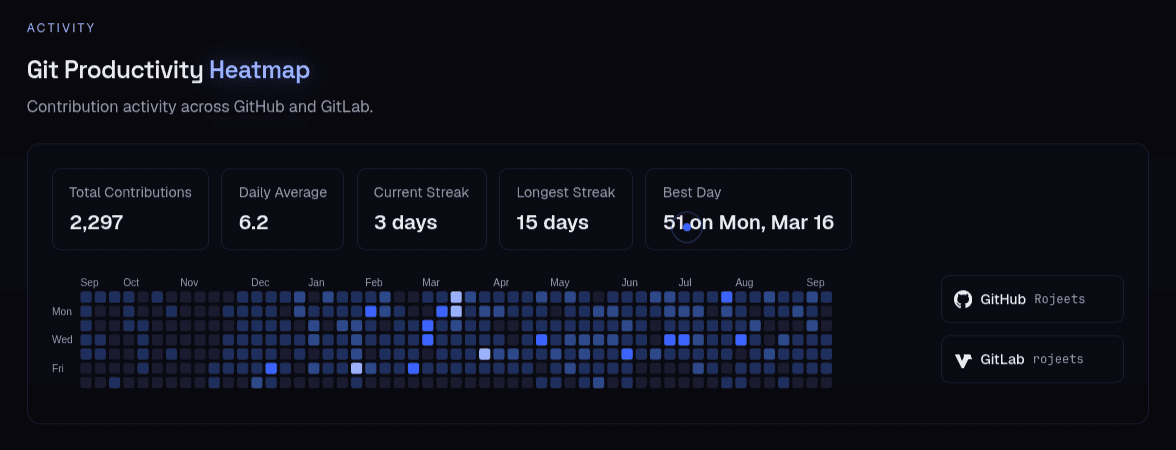
I contribute to personal projects on GitHub and client work lives on GitLab. Every contribution heatmap I found only showed one platform — hiding half my actual activity. So I built @rojeets/git-stats, an npm package that merges both into a single view.
If you work across multiple Git platforms, your contribution history is split. A GitHub heatmap shows your open-source work. A GitLab heatmap shows your professional commits. Neither tells the full story.
- ›Personal projects live on GitHub — the green squares stop there
- ›Organization work lives on GitLab — invisible to your GitHub profile
- ›No single heatmap shows your real coding activity across both
I wanted a centralized heatmap on my portfolio that merges both platforms into one view.
It fetches contribution calendars from GitHub and GitLab concurrently, merges them (summing counts on overlapping dates), and computes stats over the combined data.
import { getStats } from "@rojeets/git-stats";

const { merged, stats } = await getStats({
  github: "rojeets",
  gitlab: "rojeets"
});

console.log(stats);
// {
//   total: 1234,
//   currentStreak: 5,
//   longestStreak: 42,
//   bestDay: { date: "2025-06-01", count: 87 },
//   dailyAverage: 3.4
// }The package ships a React server component. Drop it in any Next.js page — no client-side JS, no API routes, no CORS issues:
npm install @rojeets/git-statsimport { GitStats } from "@rojeets/git-stats";
export default function SkillsPage() {
return (
<GitStats
github="your-username"
gitlab="your-username"
/>
);
}The component fetches data on the server, renders the heatmap and stats, and sends zero JavaScript to the browser.
Override colors with CSS variables for dark themes:
.git-stats {
  --gs-text: #e5e5e5;
  --gs-text-secondary: #a3a3a3;
  --gs-bg: #18181b;
  --gs-border: #27272a;
  --gs-label: #a3a3a3;
}A contribution heatmap is visual proof of consistency. When a recruiter or client visits your portfolio, they see real activity — not a static screenshot. Merging GitHub and GitLab shows the full picture.